Creating road segment interval reports
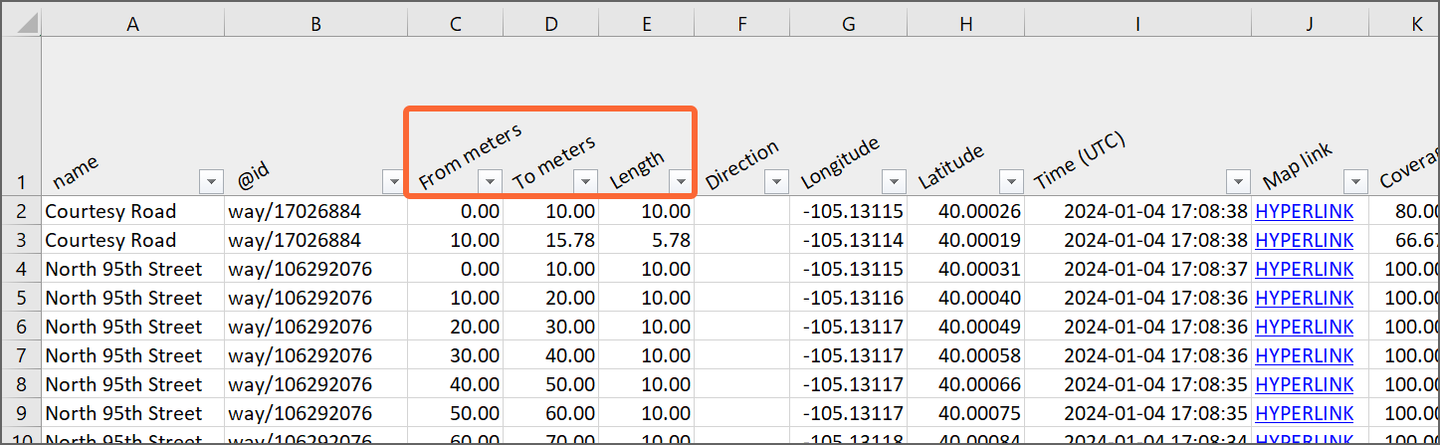
 | Report data is calculated based on the raw 5 m data sections. |
| Only asphalt road surfaces are supported. For more information on how to create a road surface condition report of concrete roads, see Creating concrete road surface condition reports (beta). |
Use road segment interval reports to get a report which presents the road surface condition and distress data per selected segment interval. Depending on the chosen interval length, the report provides a general overview of the condition of the road network and the distresses, or more granular data at a higher resolution for useful insights and further analysis.
|
|
- In the main menu, go to Data.
- In the toolbar, select Filters.
- Adjust the filters to include only a specific set of data in the report.
- In the toolbar, select Lists.
- Select Videos from the drop-down list.
-
Select the videos by selecting the respective box at the beginning of the row.

To include all the videos, select . -
Select .
The Report type window opens.
- Select Road segment interval report. Select Next.
- In the File format window, select a file format for the report. Select Next.
- In the Distance configuration window, select a distance unit, and define an interval length for the segments to be split into. Select Next.
- In the Parameters window, select Road surface. All the parameters under it in the hierarchy are selected as a result. If needed, modify the selection based on your goals and preferences. Select Next.
-
In the Data
validity window, select Defaults. The default validity filters are recommended for the most accurate data. Select
Next.
Road surface condition assessment is only supported for asphalt roads. - Select Next
-
In the Aggregation window, select an aggregation method.
The resolution of the raw measurement data is 5 m, so if the chosen interval length is 50 m, each interval can have up to 10 measurements (50 m / 5 m = 10). These multiple measurements are then aggregated into a single representative value visible in the report.
The most suitable aggregation method depends on your goals and preferences. The general recommendation is to use Select most severe value when using relatively short segment intervals such as 5, 10 or 20 meters, and either Calculate average value or Calculate weighted average value for longer segment intervals.
The following example is a visualization of how aggregation is calculated with each method in a 50 m road segment interval, depending on which option you choose for the Distress aggregation method and the Score aggregation method.This is not a visualization of the actual report. Distress aggregation method: 50‑meter road segment interval aggregation example 5 m data samples 0 m 5 m 10 m 15 m 20 m 25 m 30 m 35 m 40 m 45 m Distress extent value 43 30 33 100 100 0 0 19 25 33 Distress aggregation method Result Select most severe value 100 Calculate average value 38 In this phase, the distress-specific extent values that are reported for the chosen interval length are calculated (50 m in this example).
- Choosing Select most severe value picks the worst of all values (100 in this example) to represent the whole
interval.
The more severe the distress, the higher the value. - Choosing Calculate average value calculates the average of all the values in the interval (38 in this example).
In combined data overlays, - Select most severe value means the interval or segment is assigned the most severe value found in any of the individual 5 m measurements. For example, in the Potholes data overlay, a 50 m interval containing ten 5 m raw data measurements would be assigned Severe pothole even if only one out of the ten measurements includes a severe pothole.
- Calculate average value means, for each parameter the combined data overlay consists of, an average of extent values is calculated based on individual 5 m measurements, and then the most severe parameter exceeding its threshold value is reported.
For more information, see Combined data overlays.
Score aggregation method: 50‑meter road segment interval aggregation example 5 m data samples 0 m 5 m 10 m 15 m 20 m 25 m 30 m 35 m 40 m 45 m Condition scores 10 67 95 100 100 0 0 0 46 67 Score aggregation method Result Select most severe value 0 Calculate average value 48 Calculate weighted average value - 0 %: 0
- 25 %: 0
- 50 %: 0
- 75 %: 38
- 100 %: 48
In this phase, the overall road surface condition score that is reported for the chosen interval length is calculated (50 m in this example).
- Choosing Select most severe value picks the worst of all values (0 in this example) to represent the whole
interval.
The worse the condition, the lower the value. - Choosing Calculate average value calculates the average of all the values in the interval (48 in this example).
- Choosing Calculate weighted average value allows you to weight the poor condition roads in the score aggregation. Use the
slider to set the Min. zero score proportion.
Use this option only if you are not satisfied with the average values in reports. For example, if a heavily damaged segment is surrounded by segments in perfect condition, the average value will be high and the damaged part might not seem accurately represented. Finding the right minimum zero score proportion requires some trial and error. Experiment with different proportions by creating reports with different minimum zero score proportions until you find something that feels representative of the condition of your road network. - 0 % means choosing the lowest value (same result as choosing Select most severe value)
- 100 % mean the plain average (same result as choosing Calculate average value)
- The other options are in between the two, with the values closer to 0 % placing more weight on lower condition score values.
Set the Min. zero score proportion of each measured value that should result in a zero total score (while the other non-zero scores are 100). As shown in the previous example, if the Min. zero score proportion is set to 25 %, the score of the interval will be 0 if at least 25 % of the values equal to 0 (even if some values are of 100). See the following figures for visual examples of how weighted average values are calculated.
Figure 2. Weighted average value example: Min. zero score proportion 25% (assuming that the largest value is 100 % and lowest 0 %) 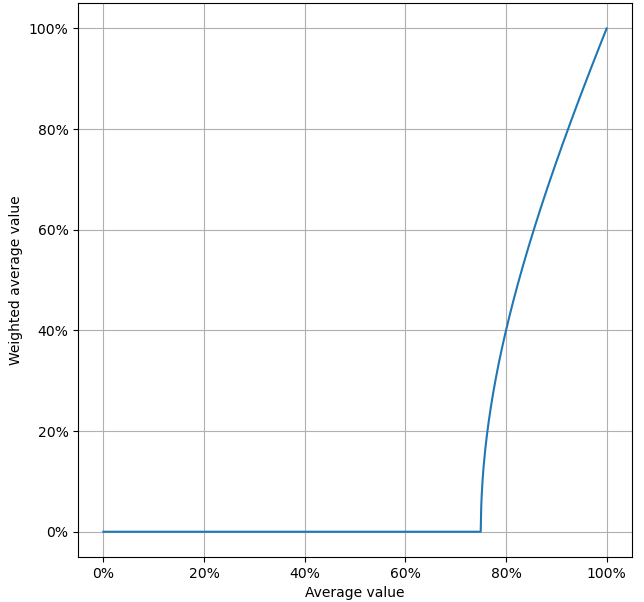
- Choosing Select most severe value picks the worst of all values (100 in this example) to represent the whole
interval.
-
In the Additional options window, selecting:
- Directional: determines if the report is calculated for both driving directions separately.
- Multiple drives: combines data from multiple drives to produce even more robust results. For both driving directions, up to three different drives can be used. The maximum time difference to the latest drive is two weeks.
- Merge driving directions: combines data from opposite driving directions to create a more complete view on the road condition. The maximum time difference to the latest drive is two weeks. If disabled, only the latest data from either of the opposite driving directions, or both in the case of a directional report, is selected for each location.
-
Select Create to create the report.
A confirmation message appears. You will get a notification in Notifications and an email with a download link when the report is ready.