Interpreting road segment interval and group reports
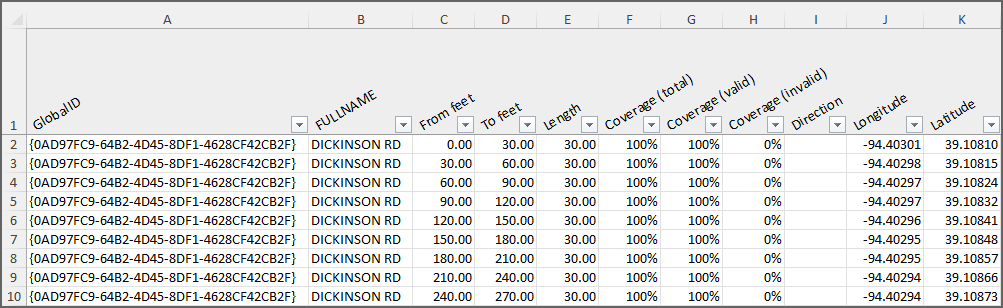
- GlobalID
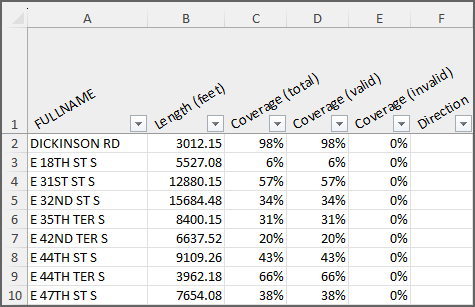
- FULLNAME
- Examples of customer-specific road network metadata configurable by users with the Admin role
- From feet (Road segment interval report)
- Start chainage of the interval
- To feet (Road segment interval report)
- End chainage of the interval
- Length
- Interval or section length
- Coverage (total)
- Portion of the total length of the interval or road section that was surveyed
- Coverage (valid)
- Portion of the interval or road section containing acceptable data based on set validity filters
- Coverage (invalid)
- Portion of the interval or road section containing data discarded by the set validity filters
- Direction
- Driving direction (increasing or decreasing chainage), as defined in the road network geometry
- Longitude
- Longitude coordinates (EPSG:4326)
- Latitude
- Latitude coordinates (EPSG:4326)
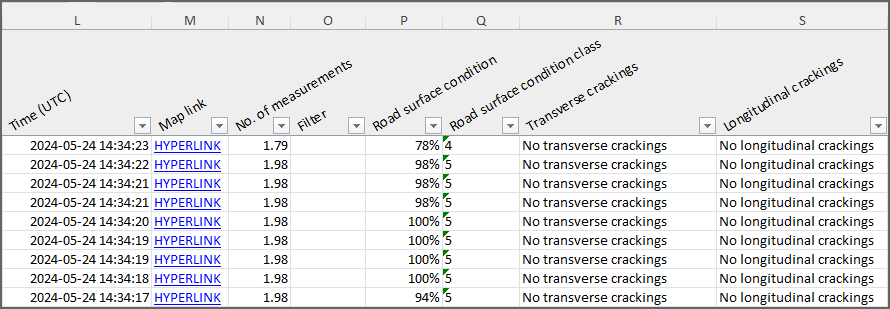
- Time (UTC)
- Date and time when distress was last detected
- Map link
- Direct link to RoadAI Web
- No. of measurements (Road segment interval report)
- How many different drives' measurements were used (This is not necessarily a whole
number because of continuous weighting between measurements from different drives. More
recent drives have a higher relative weight.)

When merging multiple drives together, the time window is two weeks from the most recent video. If the default filters are on, the weather conditions do not affect the weighting because all the data with bad conditions is left out from the report. - Filter
- If Coverage (invalid) is larger than Coverage (valid) for an interval or a road section, the Filter column indicates the primary reason.
- Road surface condition
- The road surface condition score represents the overall condition of the surface. A score of 100% represents the best possible condition and 0% the worst.
- Road surface condition class
- The road condition class is based on the condition score. A score of 0‑20 % results in class 1, 21‑40 % in class 2, 41‑60 % in class 3, 61‑80 % in class 4, and 81‑100 % in class 5.
- Transverse cracking
- If transverse cracking was detected, and its severity
- Longitudinal cracking
- If longitudinal cracking was detected, and its severity
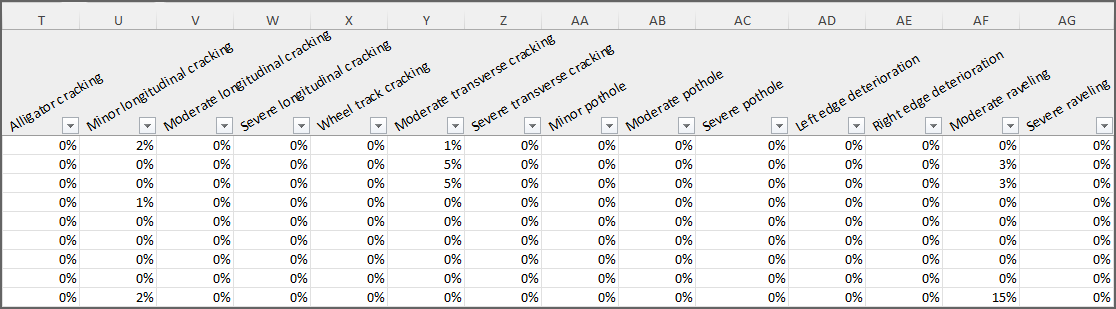
- Alligator cracking
- Minor longitudinal cracking
- Moderate longitudinal cracking
- Severe longitudinal cracking
- Wheel track cracking
- Moderate transverse cracking
- Severe transverse cracking
- Minor pothole
- Moderate pothole
- Severe pothole
- Left edge deterioration
- Right edge deterioration
- Moderate raveling
- Severe raveling
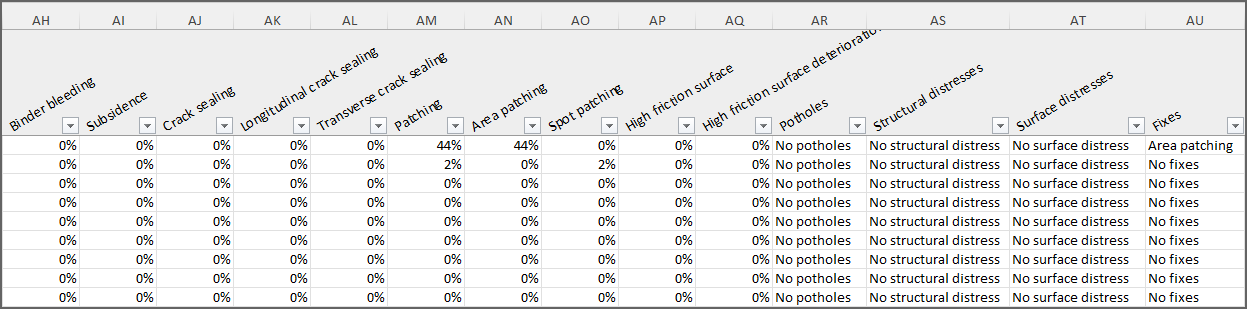
- Binder bleeding
- Subsidence
- Crack sealing
- Longitudinal crack sealing
- Transverse crack sealing
- Patching
- Area patching
- Spot patching
- High friction surface
- High friction surface deterioration
- The percentage is the extent value of the distress. This value is aggregated according to the choices made during the report creation phase.
- Potholes
- If potholes were detected and their severity
- Structural distresses
- If structural distresses were detected, and their type
- Surface distresses
- If structural distresses were detected, and their type
- Fixes
- If fixes were detected, and their type