Analyzing road surface condition data with data inspector
- With the Road surface condition data overlay active, select the road segment with a red or reddish color to open the video player. If there are multiple videos recorded on this road segment, select the most recent.
-
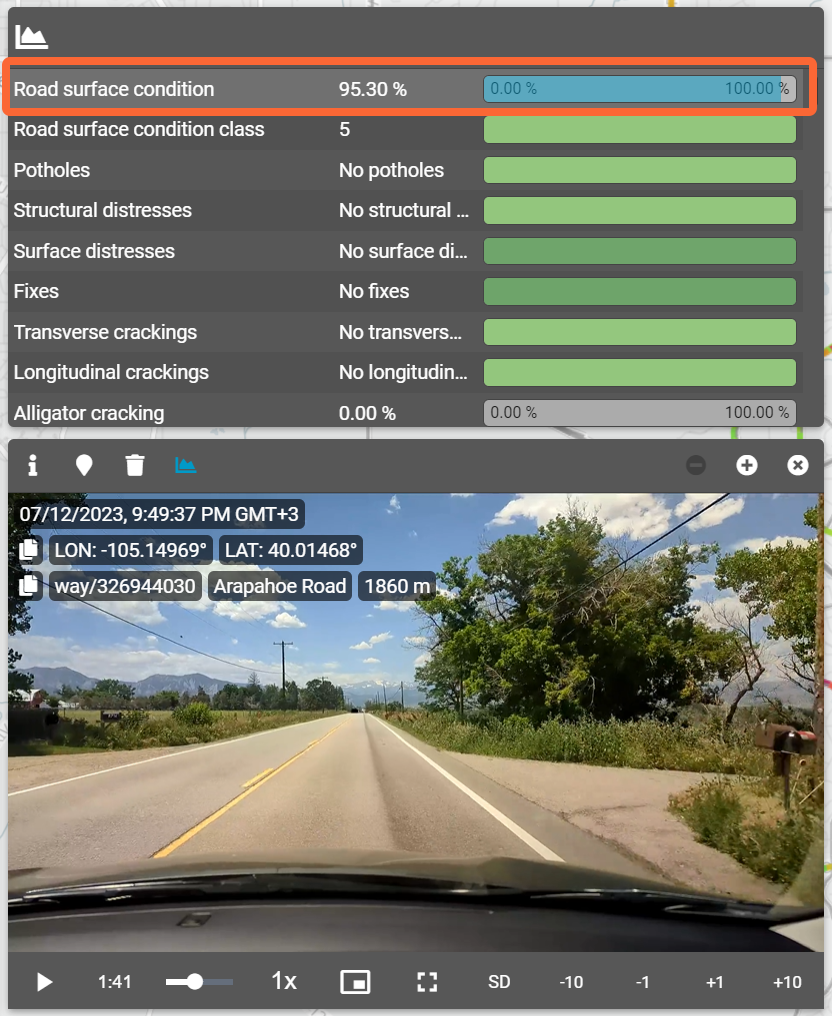
Open the data inspector.
By default, the list view of the data inspector opens.
-
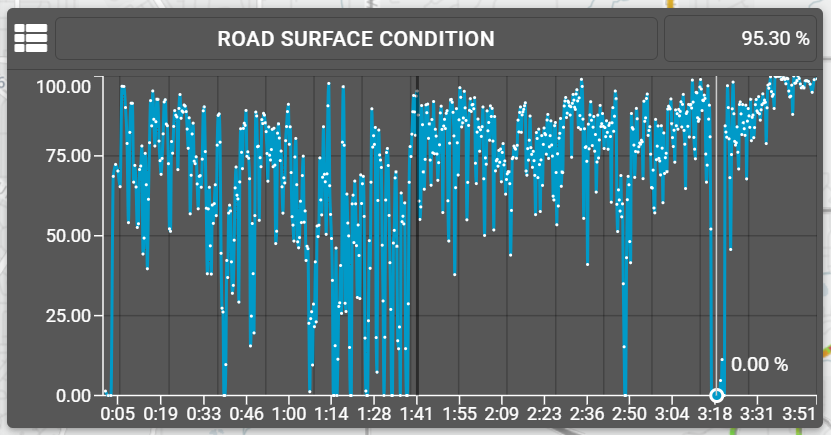
Select Road surface condition from the list to open a detailed graph.

-
The vertical line cursor on the graph indicates the current location in the video.
Observe the general development of the road surface condition score near the line cursor.
Hover over the graph with the cursor to show the corresponding score.

- Select a point that represents a general trend on the graph to jump to the location in the video.
- Select the list view icon in the upper left corner of the graph to switch to the list view.
-
Look at the individual extent values of distresses to find one or several distresses
with a high extent value contributing to the decreased road surface condition score.
Different distresses have different weights in road surface condition score calculation. Data values assigned to a data point are combined and calculated based on the analysis of multiple frames. This means that no individual frame represents the Road surface condition score.

