Analyzing line marking data with data inspector
- On the map, select a road section to inspect.
-
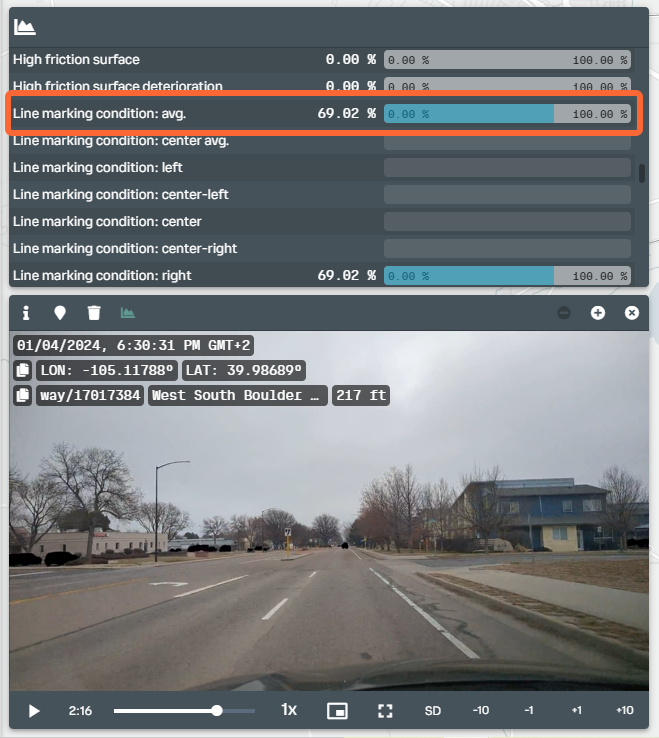
Open the data inspector.
By default, the list view of the data inspector opens.
-
Select Line marking
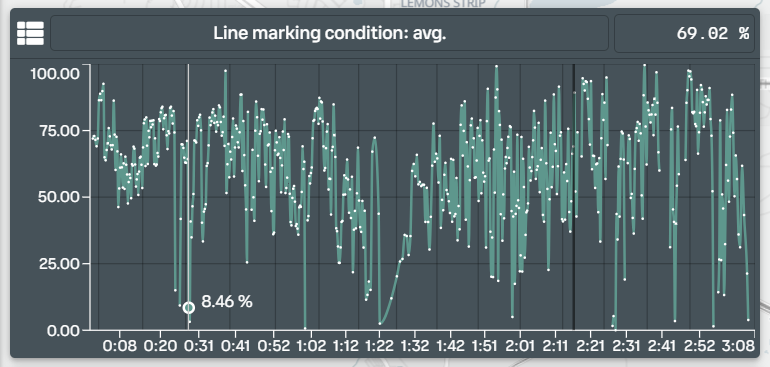
condition: avg. from the list to open a detailed graph.

-
The vertical line cursor on the graph indicates the current location in the video. Look
for a point of interest on the graph near the line cursor. Hover over the graph with the
cursor to show the corresponding score.

- Select the desired point on the graph to jump to the location in the video.
- Select the list view icon in the upper left corner of the graph to switch to the list view.
-
Look at the scores of individual lines to see their contribution to the average
score.
Road sections with no data on the graph and the list view can happen when the respective lines do not exist on that particular road section or when lines are so faint that RoadAI cannot detect them anymore.

